
Shakti “E Class” has 1 Inter Integrated Circuit (I2C) with 128kB RAM, 2 Universal Asynchronous Receiver Transmitter (UART) ports and “C Class” has 1 Universal Asynchronous Receiver Transmitter (UART) port. In this tutorial, we are going to analyze the temperature values from the bmp280 sensor and plot the graph with msmplotter in shakti-sdk.
What is BMP280?
BMP280 is a cheap and tiny atmospheric sensor breakout to measure barometric pressure and temperature readings all without taking up too much space. Basically, anything you need to know about atmospheric conditions you can find out from this tiny breakout. The BMP280 Breakout has been designed to be used in indoor/outdoor navigation, weather forecasting, home automation, and even personal health and wellness monitoring.This sensor is great for all sorts of weather sensing and can even be used in both I2C and SPI! For simple easy wiring, go with I2C. If you want to connect a bunch of sensors without worrying about I2C address collisions, go with SPI.
What is MSMPLOTTER?
“MSMPLOTTER” is a serial plotter that is used to visualize data on a serial monitor or console. It can operate on a maximum of unsigned 16-bit integers, which is not required for most usable processors. If there is any error in the input of the array, then use map() function to decrease the values of data. Also, try to decreasing the size. It can auto adjust the limits of X axis and Y axis.
This function can generate graphs from local maxima and minima with consideration of jump essential discontinuity to gradual increment or decrement.
Step 1: What will you need?
- Arty7 35t/100t board with either
pinaka, parashu or vajraprogrammed. - BMP280 sensor
- Jumper Wires
- shakti-sdk and shakti-tools installed.
Note: shakti-sdk and shakti-tools are currently a private repository. Please login or sign up to Gitlab and request access here before using it.
Step 2: The Circuit
The I2C connection (SCL and SDA pins) is used. Connections of the BMP280 sensor,
- VCC to 3.3V
- GND to GND
- SCL to SCL of board
- SDA to SDA of board
- CSB to 3.3V
- SDO to GND
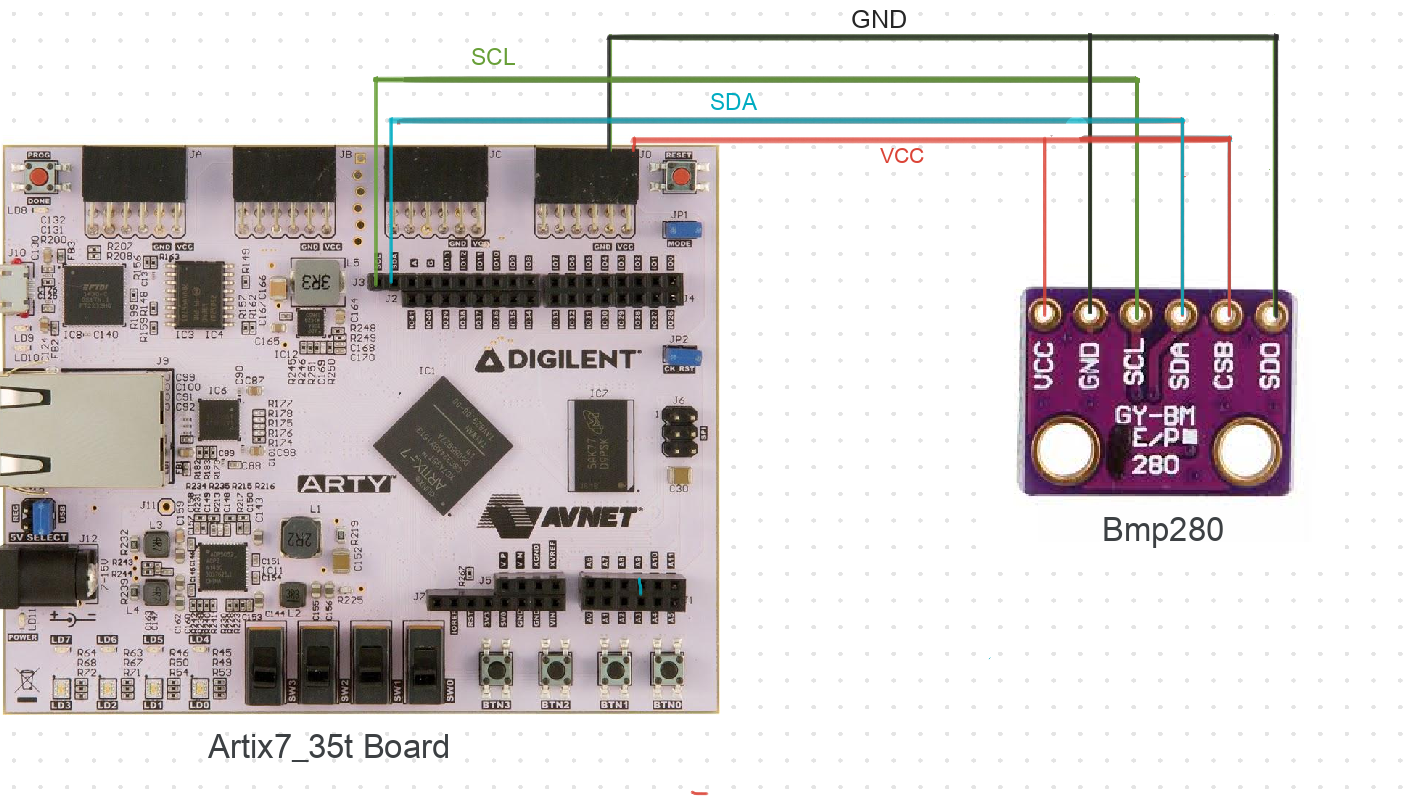
Here we use Arty35t for instance. Also, the connections are the same in Arty100t boards. For better clarity, Check the device pin mapping for pinaka, parashu and vajra.
LET’S START,
Please use the following code,
- Create a folder inside
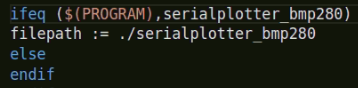
./shakti-sdk/projects. Copy and Save the above code asserialplotter_bmp280.c. Then Copy, paste the Makefile from the above document. - Then edit the make file of
./shakti-sdk/projects. Add the lines mentioned below
Step 3.1.1: Compile and build
- Move to shakti-sdk
cd ~/shakti-sdk
- Compile using make software PROGRAM=? TARGET=?. However, type make list_applns to list all the applications available in the SDK. Target can be either parashu, pinaka or vajra.
For instance, use target as parashu,
make project PROGRAM=serialplotter_bmp280 TARGET=parashu
Step 3.1.2: Execution
Once the application is built, the executable is generated in the output folder. The executable is in ELF file format and they have the extension .shakti. Now, open three terminals, one for each of the following,
- One terminal for UART terminal display (miniterm)
- Another for OpenOCD.
- And the last one for GDB server.
Terminal 1:
Firstly, Connect to serial output by using miniterm with the baud rate of 19200.
$ sudo miniterm.py /dev/ttyUSB1 19200
Note:
- “/dev/ttyUSB1” – ttyUSB means “USB serial port adapter”
- The “1” (“0” or “1” or “2”“here means the USB device number on your system. The FPGA board is connected to that USB device number.
Terminal 2: After that, Connect to the FPGA board by using the OpenOCD provided by shakti-tools and its respective configuration file. (Read how OpenOCD and RISC-V GDB work together to establish a connection between our PC and the Microprocessor)
For instance, if we use parashu,
$ cd shakti-sdk
$ cd ./bsp/third_party/parashu
$ sudo $(which openocd) -f ftdi.cfg
For pinaka and vajra, Goto cd ./bsp/third_party/<pinaka or vajra>
Terminal 3: Now, open either 32bit or 64bit RISC-V GDB based on your architecture i.e riscv32-unknown-elf-gdb or riscv64-unknown-elf-gdb respectively from shakti-tools.
The output executable is created in <path-to-shakti-sdk>/software/projects/serialplotter_bmp280/output as serialplotter_bmp280.shakti.
Now load up the .shakti file by following the below steps. For Parashu,
$ riscv32-unknown-elf-gdb
(gdb) set remotetimeout unlimited
(gdb) target remote localhost:3333
(gdb) file ./software/projects/serialplotter_bmp280/output/serialplotter_bmp280.shakti
(gdb) load
(gdb) c
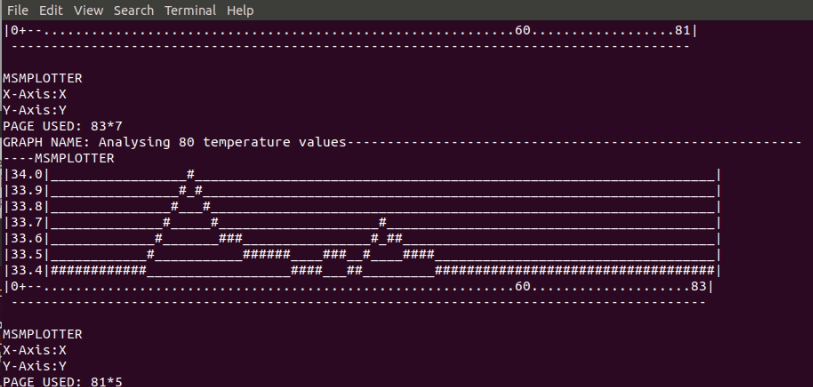
Step 4: Output
Check the output in Terminal for MSMPlotter,

Mainak is an intern at the RISE labs. He has also interned at the Department of Atomic Energy (UGC-DAE-CSR), Kolkata. His favorite subjects are “Digital Electronics” and “Microprocessor & Micro-controller”. He is also an open source library contributor at Arduino.