
In the last article, we saw the commands used in RISC-V GDB to debug a program. In addition to that, we are going to see how to use objdump and the RISC-V GDB to debug a program. Because, as we know GDB lets us dissect a program and inspect it part by part. Let’s see just how to do that!
Firstly let’s start with a simple ASM program with if-else statements and arithmetic operations. Then there’s a video tutorial available for understanding and debugging an ASM program to determine whether the given number in an array is even or odd.
What is objdump?
objdump is a command-line program for displaying various information about object files on Unix-like operating systems. As a result, it can be used as a disassembler to view an executable in assembly form.
The objdump can be generated from a .elf file. For instance,
riscv64-unknown-elf-objdump -d filename.elf &> filename.dump
RISC-V basics
The RISC-V Green card gives us all the assembly instructions used in RISC-V. Also, check out our ASM Manual to know more about the Assembly Programing
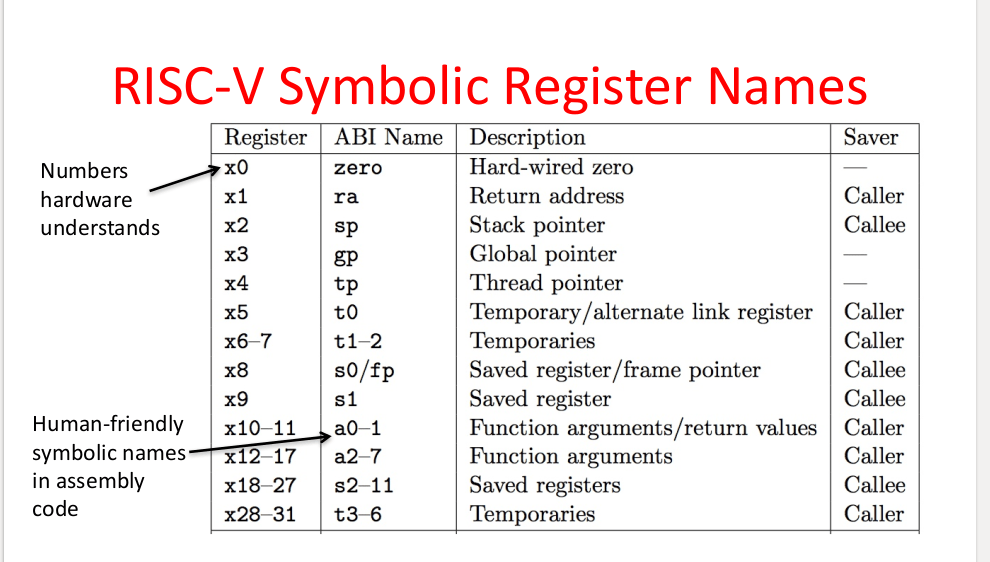
Firstly the registers in RISC-V is as follows,
Debugging an ASM program with GDB
spiking is a folder that contains all the board support files for you to debug an asm or a c program. Therefore you can use either spike (RISC-V Emulator) or arty7 boards with GDB.
Note: However, shakti-sdk, shakti-tools and spiking are currently a private repository. Please login or sign up to Gitlab and request access here before cloning.
Moreover in this article, we would debug this asm program with spike (RISC-V emulator) and RISC-V GDB. Check here for elaborate steps.
If you want to debug this program with GDB and Arty7 boards, Click here!
Firstly clone the spiking folder.
git clone https://gitlab.com/shaktiproject/software/spiking.git
Let’s consider a simple if-else program. For instance, save this as example.S
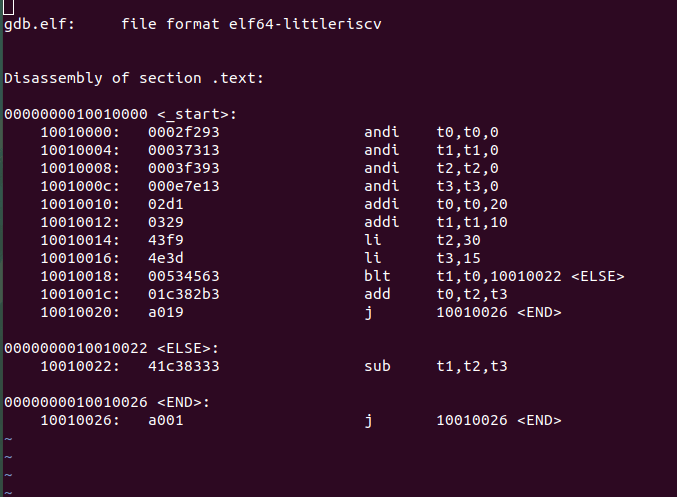
_start: andi t0, t0, 0 #initialization andi t1, t1, 0 andi t2, t2, 0 andi t3, t3, 0 #arithmetic Operationsaddi t0, t0, 20 # t0=t0+20, t0=20addi t1, t1, 10# t1=10li t2, 30# t2=30li t3, 15# t3=15bgt t0, t1, ELSE# Branch if t0 > t1add t0, t2, t3 j ENDELSE: sub t1, t2, t3 END: j END
Then compile this program using this command,
riscv64-unknown-elf-gcc -nostdlib -nostartfiles -T spike.lds example.S -o example.elf
Then generate the objdump for this program from the elf file
riscv64-unknown-elf-objdump -d example.elf &> example.dump
So the objdump for this program looks like this,
- First column – Address of a particular instruction.
- Second column – RISC-V instructions
. - Third column – ABI name of the registers.
Open 3 Terminals for debugging,
Note: However ensure all the commands are executed inside the spiking folder as it contains all the board support packages.
Terminal 1:
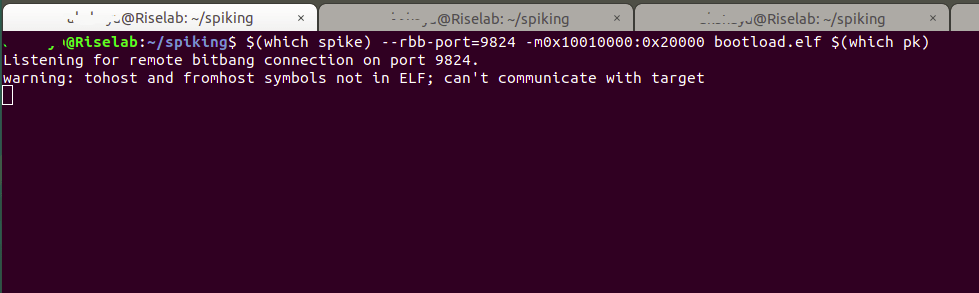
Firstly, Open a terminal with spike
cd spiking

riscv64-unknown-elf-gcc -nostdlib -nostartfiles -T spike.lds bootload.S -o bootload.elf

$(which spike) --rbb-port=9824 -m0x10010000:0x20000 bootload.elf $(which pk)
Terminal 2:
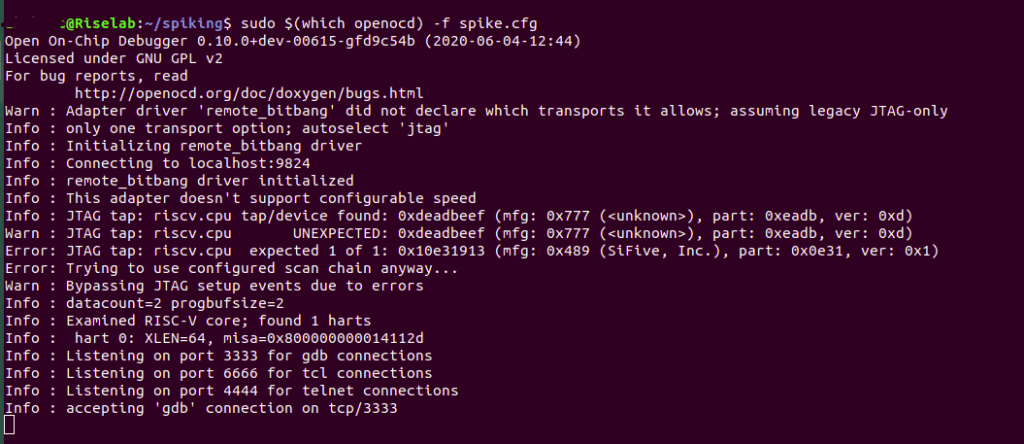
Then, Open a terminal with OpenOCD
sudo $(which openocd) -f spike.cfg
Terminal 3:
Then open a terminal for RISC-V GDB,
riscv64-unknown-elf-gdb
(gdb) set remotetimeout unlimited
(gdb) target remote localhost:3333
(gdb) file path/to/executable
(gdb) load
(gdb) c
At address 0x10010000 in start() in other words the first line of the program.
Step 1:
So see the objdump and set the breakpoints at appropriate addresses.
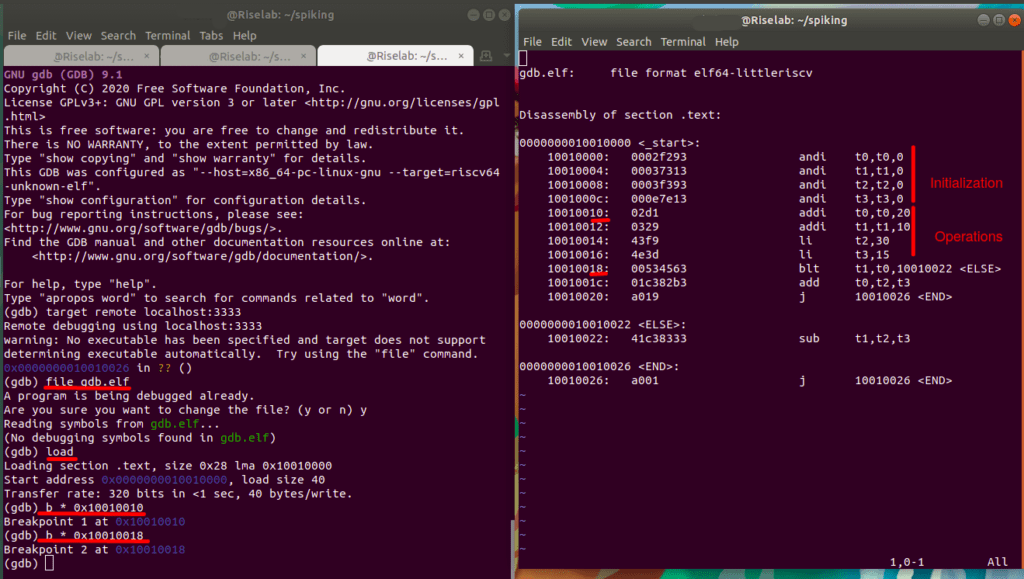
Firstly, set the Breakpoint 1 after the initialization of all the 4 temporary registers(t0, t1, t2, t3), at 0x10010010.
Then Set the Breakpoint 2 after the values of the registers are assigned, at 0x10010018.
Step 2:
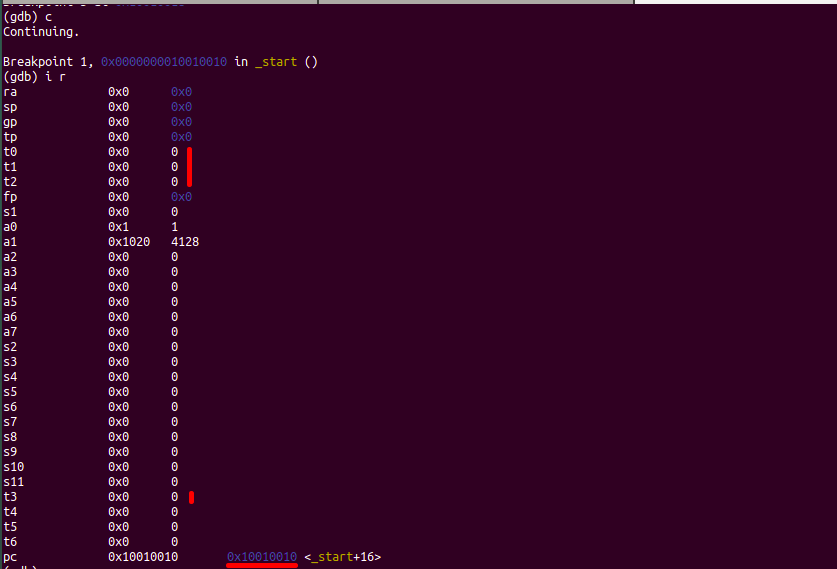
Press C to Continue. However the execution stops when the 1st breakpoint is encountered.
Program counter specifies the next instruction to be executed by the system.
At address 0x10010010 – breakpoint 1 in start(), so info reg gives the value of registers. As a result, the register values are initialized.
Step 3:
PC: 0x10010010 in START, in other words the next instruction that compile executes.
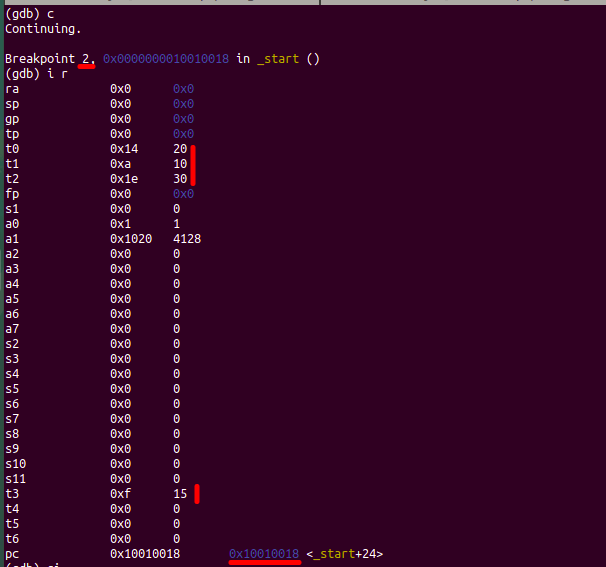
Press C to Continue again. However the Continue command stops the execution again when the 2nd breakpoint is encountered.
At address 0x10010018 – breakpoint 2 in start(). So info reg gives the value of registers. As a result, the register values are assigned.
Step 4:
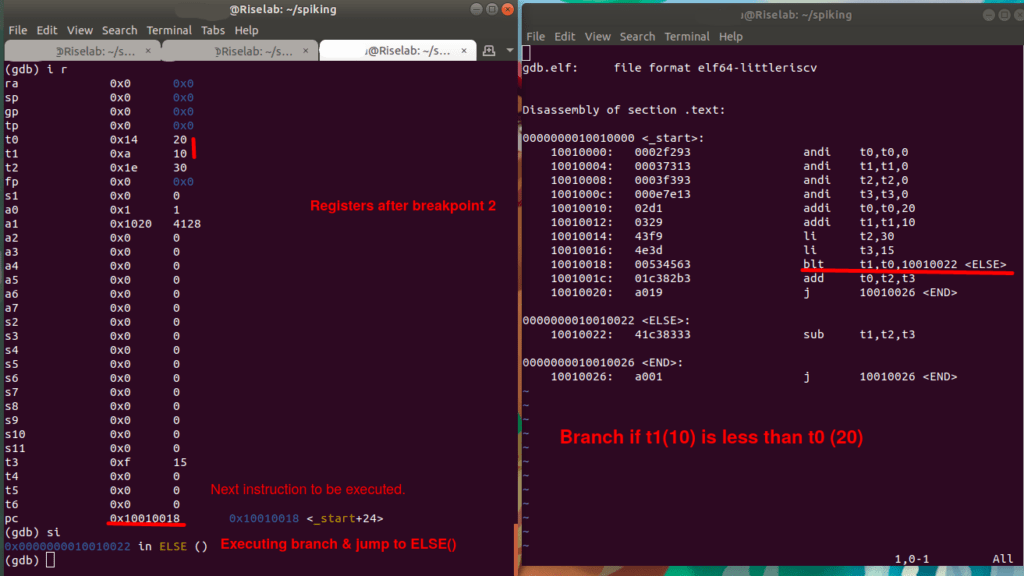
PC: 0x10010018 in START(), in other words the next instruction that compile executes.
Then step in (s i) the program. Then execute the branch instruction at 0x10010018. As a result, the compiler jumps to ELSE() at 0x10010022
Step 5:
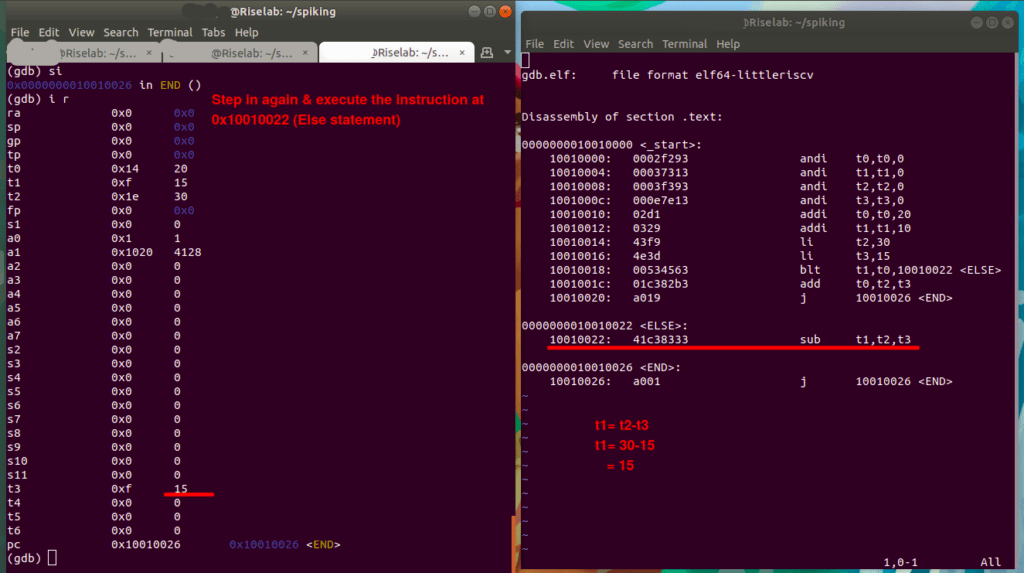
PC : 0x10010022 at ELSE(), in other words the next instruction that compiler executes.
Then step in (s i) and execute the instruction at 0x10010022.
10010022: sub t1, t2, t3
t1=t2-t3
t1=30-15 =15
In conclusion, this image shows the value of t1 after the execution of else statement,
Now let’s consider a program that is slightly complicated. For example, an ASM program with an array input and a for loop nested with If-else.
ASM to determine if the number in array is odd or even.
_start:
.data
Array: .byte 12,19,45,69,98,23
.text
  andi t0, t0, 0
  andi t1, t1, 0
  andi t2, t2, 0
  andi t3, t3, 0
  andi t4, t4, 0
  andi t5, t5, 0
  li t4, 6
  li t5, 2
FOR_loop: bge t3, t4, END
          la t2, Array
          add t2, t2, t3
          lb t2, 0(t2)
          rem t2, t2, t5
IF: bnez t2, ELSE
    addi t0, t0, 1
    addi t3, t3, 1
    j FOR_loop
ELSE:
    addi t1, t1, 1
    addi t3, t3, 1
j FOR_loop
END: j END
So try debugging this on your own. Then check out this video on Our Youtube Channel on Understanding and compiling an ASM Program.
Then check out this video on Debugging the ASM Program using RISC-V GDB and spike
Akshaya currently works at the RISE labs. Her favorite subjects are Web designing and Microprocessors. She loves learning about new things and writing about them!