
Have you ever had a screen with no output and you have no idea what’s happening behind the screens or you get some output but not what you expected? This is called a trap wherein you are trapped at a point without knowing your next step. In this article, we are going to discuss how to find the exact point the trap occurs and the reason behind it so that it’s easier for debugging.
Trap & Trap Handling
Exception or trap or interrupt is an unusual condition occurring at the run time of the instruction in the current RISC-V hart. This disrupts the normal flow of instruction execution. Exceptions are usually synchronous. Interrupts are another form of a trap, where the origin of interrupt is from Timer or peripherals.
When the trap occurs the control is transferred to a trap handler. A “trap handler” is a subroutine that handles the trap in software. The Traps can be handled or ignored, it is up to the developer to decide.
What happens when a trap occurs?
So when a trap occurs, the program execution is stopped.
- The MEPC is set to the last instruction that was executing when the
trapoccured. - The privilege mode is set to Machine Mode.
- The MIE (Interrupt enable) bit in the status word is set to 0.
- The MCAUSE register is written by the hardware with a code indicating the event that caused the
trap.
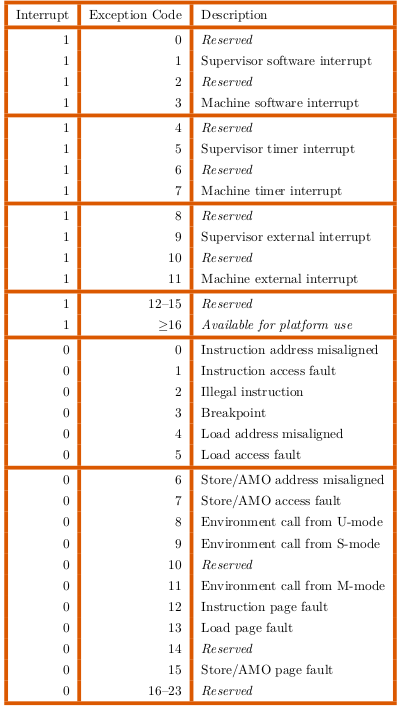
The list of numeric codes are listed below,
Let’s have a look at the MCAUSE table with the exception codes and their description,
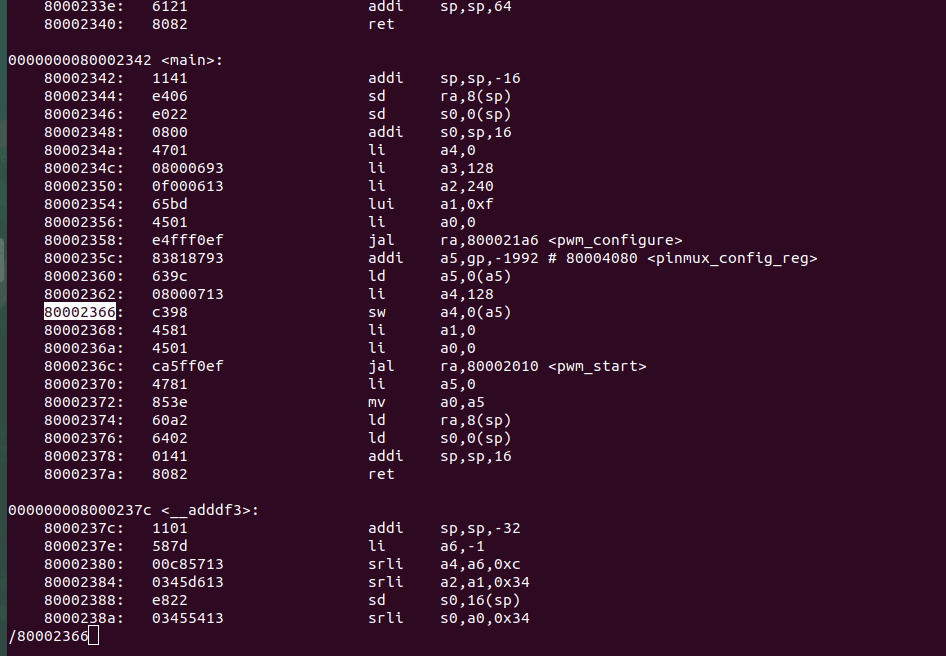
We have already seen how to debug a program using objdump and RISC-V GDB. Now we are going to use the objdump and figure out the cause of the trap.
We know that MEPC/EPC contains the address to the last instruction executed while the trap occurred.
Compare the address in EPC with the objdump of the program to find out which function (and its parameters) has caused the Trap. Like this you can find out the exact instruction that causes the issue. You can check the arguments passed to the instruction and debug further.
Example
We are going to induce a trap here for our better understanding. Let’s change PINMUX_CONFIGURE_REG value. The Pinmux config register helps in masking the GPIO pins as PWM pins. So when we change that, the processor doesn’t have memory designated for PWM. Now when we execute pwmled in shakti-sdk, it throws a store access fault.
Output in miniterm,
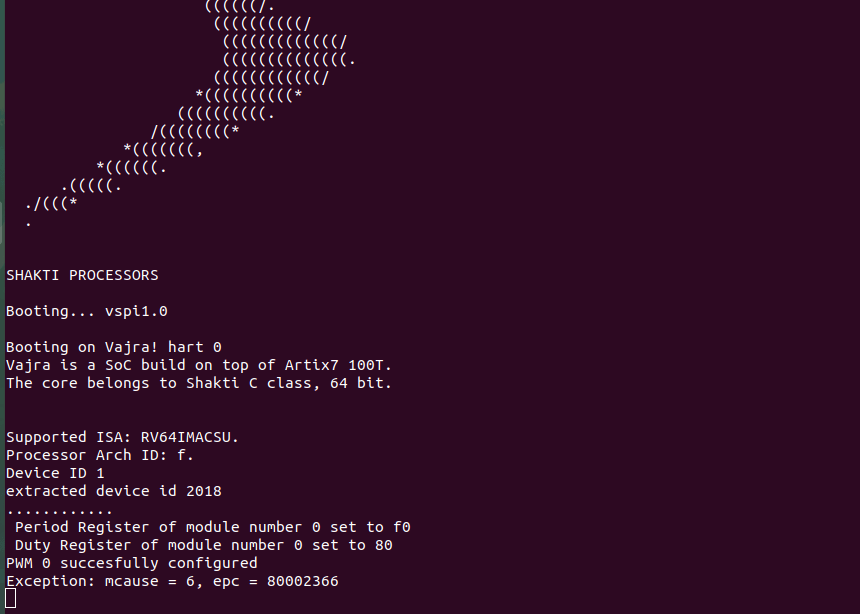
Exception: mcause = 6, epc = 80002366,If we see the mcause table, mcause value 6 is due to store access fault. If we check the objdump (created in <path to shakti-sdk>/software/examples/pwm_applns/pwmled/output) of this program, we can find the exact instruction that is causing the trap.
Now that we know the exact cause of the problem, it’s easier to debug the program. Check out the article on RISC-V GDB commands that are used for debugging.
Akshaya currently works at the RISE labs. Her favorite subjects are Web designing and Microprocessors. She loves learning about new things and writing about them!